As of December 21, Radio Locator shows that more than 350 stations in the U.S. and Canada have switched to playing holiday music around the clock. Christmas music is a unique phenomenon - no other holiday has such popular and specific music to make stations bench Carrie Underwood and The Weeknd for old standards from Perry Como and Bing Crosby.
While it's nice to think that radio execs are holiday enthusiasts wearing Christmas tree vests and pushing turtle fudge, the real reason that stations make the change is that holiday formats have been shown to boost ratings more reliably than Rudolph's red nose cuts through fog.
This time of year, we hear it everywhere: at work, walking through the mall, scanning radio stations on the commute to work. Some of us can't get enough "Santa Baby" and "Jingle Bell Rock" while some are going to poke their eyes out with a chocolate-covered pretzel rod if "All I Want for Christmas is You" comes on one more g.d. time.
Christmas Radio Coverage in the U.S.
Is each state as permeated by Mariah as the rest? How does each state rank in terms of number and percent of radio stations converting to the holiday format? We cross-referenced FCC records* with the Radio Locator list to build a map with estimated coverage areas for each holiday station.
There are clearly areas of the country where it's a challenge to come by a station pumping out Wham! and Gene Autry Christmas classics, while in others there's a myriad of radio options.
> Data: [Radio Locator](http://radio-locator.com/cgi-bin/finder?format=xms&count=356&s=R&sr=1&is_ful=Y&is_lp=Y&prev=0) Christmas list and [FCC](https://www.fcc.gov/media/radio/fm-service-contour-data-points) service contour estimatesNote: since there is no official list of Christmas stations, it's possible that Radio Locator has overlooked a station here or there, or that a station has switched to full time Christmas music since this data was pulled.
States Ranked by Number of Christmas Stations
Scroll to see all 50 + D.C.
| Rank | State | Total FM | Holiday FM | Percent |
|---|---|---|---|---|
| 1 | Pennsylvania | 373 | 20 | 5.4% |
| 2 | California | 686 | 19 | 2.8% |
| 2 | Florida | 382 | 19 | 5.0% |
| 2 | Texas | 798 | 19 | 2.4% |
| 3 | Ohio | 332 | 15 | 4.5% |
| 4 | Indiana | 275 | 13 | 4.7% |
| 4 | New York | 421 | 13 | 3.1% |
| 5 | Virginia | 230 | 12 | 5.2% |
| 6 | Illinois | 364 | 10 | 2.8% |
| 6 | Minnesota | 269 | 10 | 3.7% |
| 7 | Colorado | 246 | 9 | 3.7% |
| 7 | Oregon | 232 | 9 | 3.9% |
| 7 | Washington | 210 | 9 | 4.3% |
| 7 | West Virginia | 132 | 9 | 6.8% |
| 8 | Georgia | 311 | 8 | 2.6% |
| 8 | Iowa | 209 | 8 | 3.8% |
| 8 | Michigan | 348 | 8 | 2.3% |
| 8 | Tennessee | 241 | 8 | 3.3% |
| 8 | Wisconsin | 248 | 8 | 3.2% |
| 9 | Alabama | 223 | 7 | 3.1% |
| 9 | Missouri | 289 | 7 | 2.4% |
| 9 | New Jersey | 104 | 7 | 6.7% |
| 10 | Kentucky | 234 | 6 | 2.6% |
| 11 | Massachusetts | 141 | 5 | 3.6% |
| 11 | North Carolina | 249 | 5 | 2.0% |
| 11 | Nebraska | 141 | 5 | 3.6% |
| 11 | South Carolina | 160 | 5 | 3.1% |
| 11 | Utah | 93 | 5 | 5.4% |
| 12 | Arkansas | 234 | 4 | 1.7% |
| 12 | Connecticut | 62 | 4 | 6.5% |
| 12 | Louisiana | 212 | 4 | 1.9% |
| 12 | Oklahoma | 220 | 4 | 1.8% |
| 33 | Arizona | 191 | 3 | 1.6% |
| 13 | New Hampshire | 71 | 3 | 4.2% |
| 13 | New Mexico | 199 | 3 | 1.5% |
| 14 | Alaska | 138 | 2 | 1.5% |
| 14 | Idaho | 126 | 2 | 1.6% |
| 14 | Maryland | 80 | 2 | 2.5% |
| 14 | Mississippi | 206 | 2 | 1.0% |
| 14 | Montana | 169 | 2 | 1.2% |
| 14 | Nevada | 94 | 2 | 2.1% |
| 15 | D.C. | 15 | 1 | 6.7% |
| 15 | Delaware | 24 | 1 | 4.2% |
| 15 | Kansas | 197 | 1 | 0.5% |
| 15 | North Dakota | 86 | 1 | 1.2% |
| 15 | Rhode Island | 23 | 1 | 4.4% |
| 15 | Vermont | 72 | 1 | 1.4% |
| 16 | Hawaii | 72 | 0 | 0% |
| 16 | Maine | 104 | 0 | 0% |
| 16 | South Dakota | 112 | 0 | 0% |
| 16 | Wyoming | 154 | 0 | 0% |
While Pennsylvania, California, Florida and Texas have a staggering 19 or 20 Christmas stations each, considering population size and the presence of several large population centers, we shouldn't be surprised.
The real Christmas fanatics must live in West Virginia, Connecticut and Washington, D.C., who saw more than 6% of their FM stations get in the spirit, compared to lower percentages like 2.8% in California and 2.4% of stations in Texas.
All I Want for Christmas is Higher Ratings
Does each station really experience the same spike in ratings? Or are some metro areas just too Christmas-ed out to tune in?
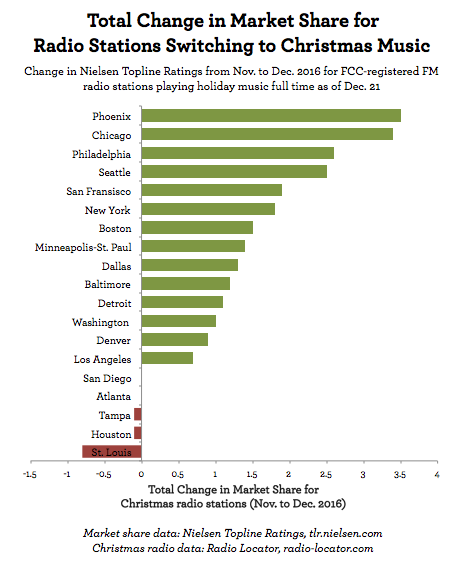
We used Nielsen's monthly topline ratings to compare changes in market share from November to December (when most stations change to holiday format) in Nielsen-subscribed stations. Market share refers to the estimated percentage of listeners in the market listening to a particular station.
Here, we added up the change for all holiday stations in a given market (e.g. for three stations, +2, +1 and -1, the total change would be +2).
[
Data: Radio Locator Christmas list and Nielsen topline ratings for subscribed stations
Phoenix's sole Christmas station gained 3.5% in market share since November. Chicago, Philadelphia and Seattle are among other metro areas with listeners flocking to festive radio waves.
St. Louis, Tampa and Houston were the only metro areas to see stations converting to holiday music actually lose market share; in St. Louis, their Scrooge population cost holiday stations nearly 1% of listeners.
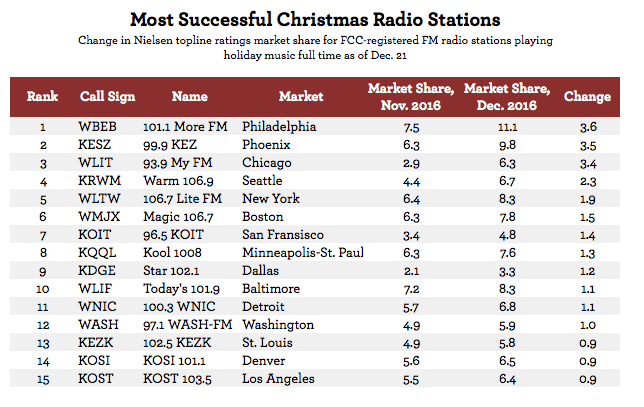
Are certain holiday stations more successful than others?

Data: Radio Locator Christmas list and Nielsen topline ratings for subscribed stations
Philadelphia's 101.1 More F, Phoenix's 99.9 KEZ and Chicago's 93.9 My FM have seen a 3.4%+ gain in market share since November due to their conversion to an all-holiday format.
Christmas radio is a strategic decision made by stations to boost ratings and generate general good-will around the holidays, though not all markets feel the same; listeners in Phoenix and Chicago flock to Christmas stations, while Missourians in St. Louis change the station faster than Buddy the Elf makes snowballs.
**
Notes
*The FCC publishes daily FM station service contour estimates with the location of each registered FM station along with a set of 360 latitude and longitude points that estimate how far the signal will carry, depending on the strength and directionality of the signal as well as topographical features. For simplicity, we calculated a radius based on the Haversine distance between the transmitter and eight equally spaced (45 degrees apart) contour points.
The R code for calculating each station's estimated service radius and combining that with Nielsen rating data and the Radio Locator Christmas list can be found in my Github repo christmas-radio.
