Incorporating a Halloween-themed episode into a television series season is not a new thing.
In the 1960s, it started with Halloween-y television shows like Bewitched, The Addams Family, and The Twilight Zone. By the early 1970s, the idea spread to mainstream television programs with The Brady Bunch (1972), Happy Days (1974) and Little House on the Prairie (1976).
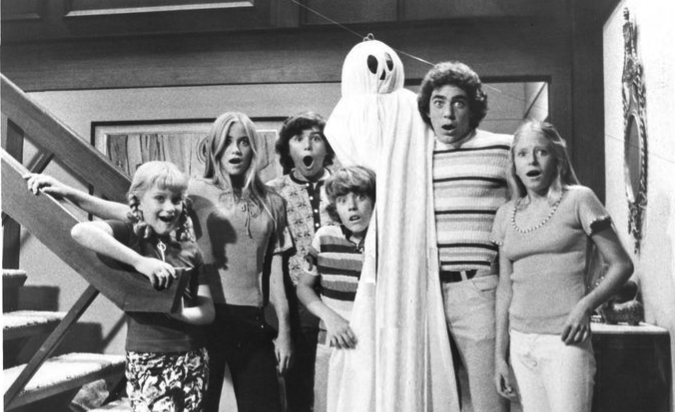
"Fright Night," episode 6 of season 4 of The Brady Bunch
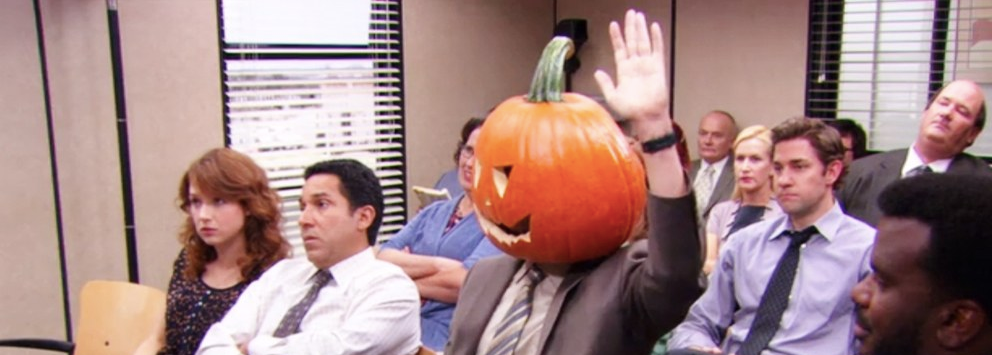
In 1990, The Simpsons took the concept and spun up the Treehouse of Horror, which would become an annual installment in the long-running animated series. By the early 2000s, the Halloween episode was pervasive in teen and comedy television. Even dramas like ER and NCIS found ways to weave the spooky holiday into their storylines.
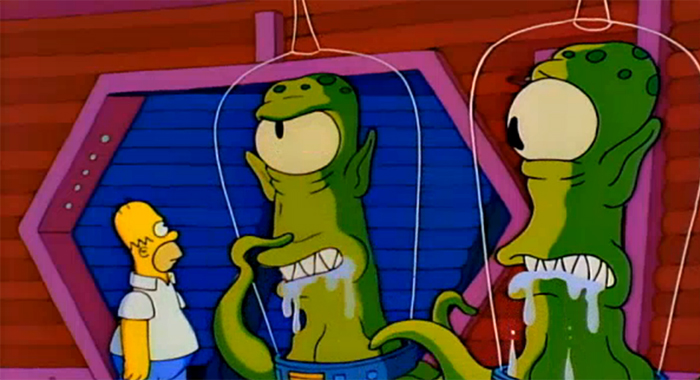
“Treehouse of Horror VII: Citizen Kang,” episode 1 of season 8 of The Simpsons
A lively holiday like Halloween may give writers more leeway to have fun with the show's characters in a way that differs from a regular season episode. It's a new setting that offers new possibilities, but are they actually better than regular episodes? Or are they just an easy way to fill an episode slot?
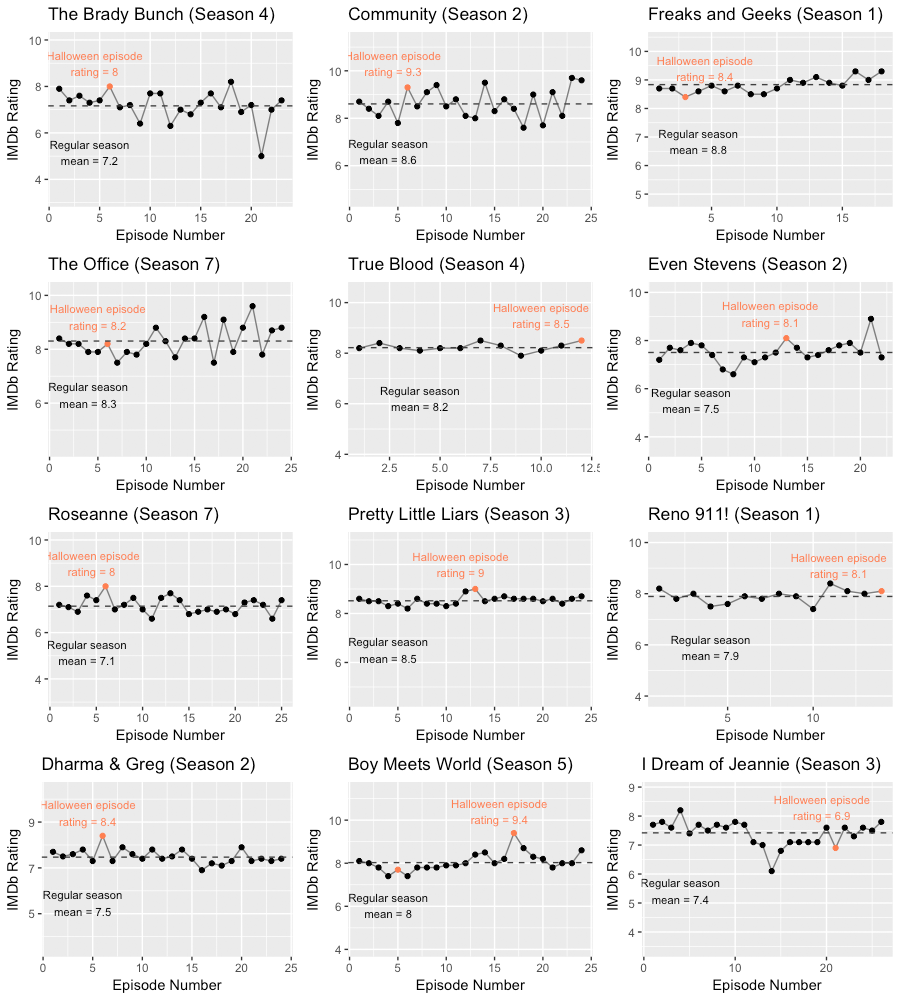
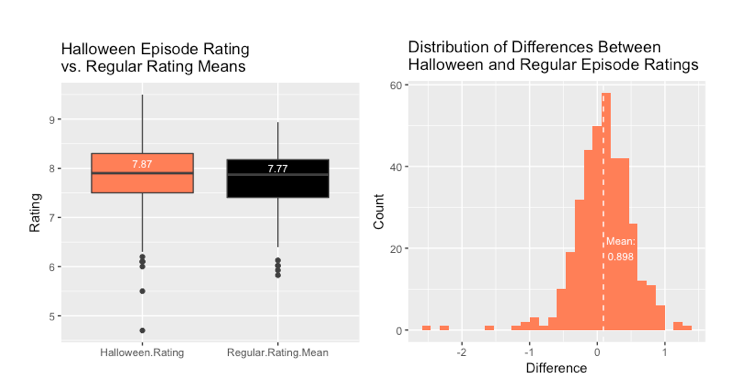
To find an answer to that question, I scraped rating data from IMDb for more than 24,000 episodes belonging to 1,000 seasons of 184 television shows. A paired t-test comparing the Halloween episode rating and average rating of regular episodes from that particular season revealed that Halloween TV episodes are better than regular episodes. The effect is small - an increase of about 0.089 in average rating - but significant.
Read on for the method, data and results of this study, or jump right into your favorite spooky episode using this handy list from Collider of All the Halloween Episodes You Can Watch on Netflix Right Now.
Method
To gather episode-level ratings, I started with a list of Halloween episodes from Wikipedia (skipping the Children and Family and Sketch and Variety Show sections). From there, I ran a script in R to search for the series name at IMDb and collect its ID number. Then, the ID number was used to iterate over the pages of its episode list to grab episode ID numbers, which were then iterated through to grab its rating, number of ratings, genre, release date, etc. The final dataset is available here and contains 24,378 episodes from 1,180 seasons of 184 television shows. It hasn't been meticulously cleaned up.
The trend has exceptions, of course, and is influenced by variation in the season ratings.
Paired T-Test
There isn't a perfect test for this question, but a paired t-test likely comes the closest. Paired t-tests are used to determine if paired observations come from the same distribution or not; for example, a student's exam test before a study group and their exam test after a study group. The observations are paired for each student to help account for variability between subjects.
In this case, each season has 9-22 non-Halloween episodes and 1 Halloween episode. In order to fit within the t-test framework, we need one "regular rating" observation per Halloween episode. To create that, an average (mean and median) rating of the non-Halloween episodes for that season was used for comparison. This also helps account for differences in rating between seasons.
In order to conduct a paired t-test, the two main assumptions are that the dependent variables are normally distributed and that the differences between the two groups are normally distributed. The original data was not, but a transformation (to the fourth power) allowed both the Halloween rating and the mean regular rating to pass a Shapiro test for normality.
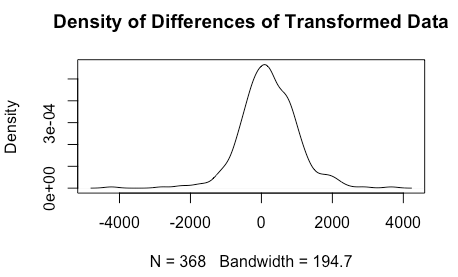
Though the differences appeared normally distributed, they did not pass a Shapiro test. For these purposes (light data exploration), we'll forge onward despite the violation.
A glance at the data and the t-test results are shown below.
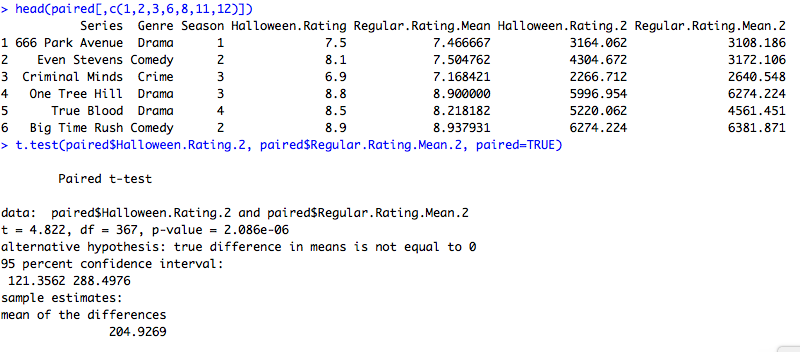
The test is significant at t = 4.822 and p < 0.00. The mean of the untransformed differences is actually 0.089, which means that on average, a Halloween episode receives a ratings bump of about 0.9.
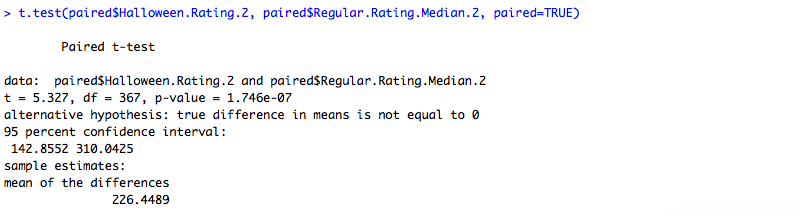
The effect is valid when comparing against the regular season median instead of mean. The medians were also transformed to the fourth power before comparison.
Halloween TV episodes aren't just filler. They offer new situations and tropes that viewers enjoy - and they get higher ratings because of it.