
Trilogies are common in sci-fi and fantasy books and movies, fitting nicely into the broad story template known as the hero's journey, where a central character goes on an adventure, wins a victory, and comes home changed.
"If you make a trilogy, the whole point is to get to that third chapter, and the third chapter is what justifies what's come before." - Peter Jackson
Are all three parts of the trilogy equally "good"? Is the call to adventure more exciting than the homecoming? Is the middle installment just filler to move the plot to the final climax?
I took a sample of book and series trilogy ratings to find out. Movie trilogies get worse, losing favor with each film, while book trilogies secure higher ratings for book 2 and maintain them for book 3.
This could be for a variety of reasons.
It could be that book content is better. Authors have the opportunity to lay out the full arc from the start, resulting in a more cohesive story, while movie trilogies are often constructed quickly following box office success, resulting in third act disasters like The Matrix: Revolutions or slapdash profit-grabs like Legally Blonde 3: Legally Blondes.
It could be that book ratings for later trilogy installments are biased: why would a reader who didn't like book 1 read and rate book 2? The pool of users who rate the second and third books are likely the readers who rated the first book positively, resulting in higher ratings for the subsequent books. This effect may present in movie rating, but the time commitment is less of a barrier: 90 minutes to watch Men in Black II versus 20 hours to read A Court of Mist and Fury.
Read on for a full discussion of the data, method and results.
The Data
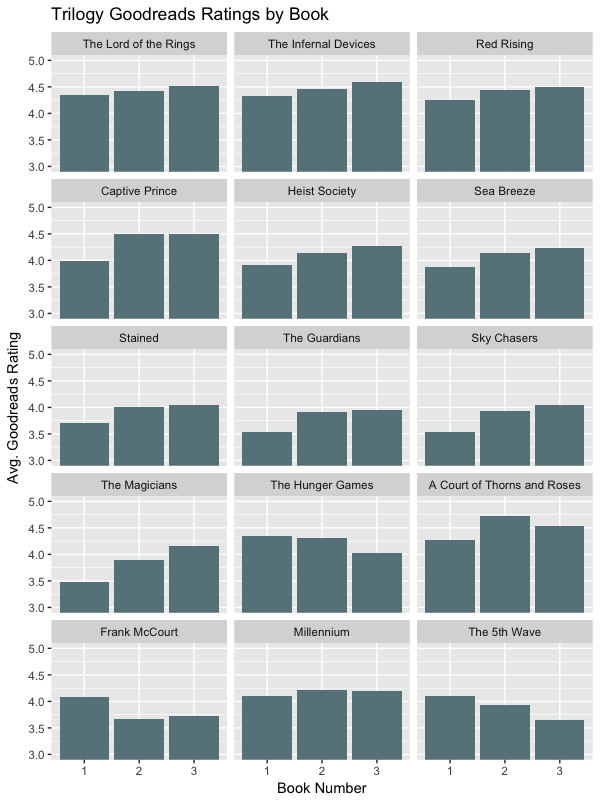
First, let's explore a few of the trilogies considered. The full dataset can be found at the conclusion of this article.
The Lord of the Rings, The Magicians, and Red Rising trilogies are among those who improved in rating with each book. The Hunger Games lost rating with each book, while series like A Court of Thorns and Roses and Millennium (The Girl with the Dragon Tattoo series) had peaks at book 2.
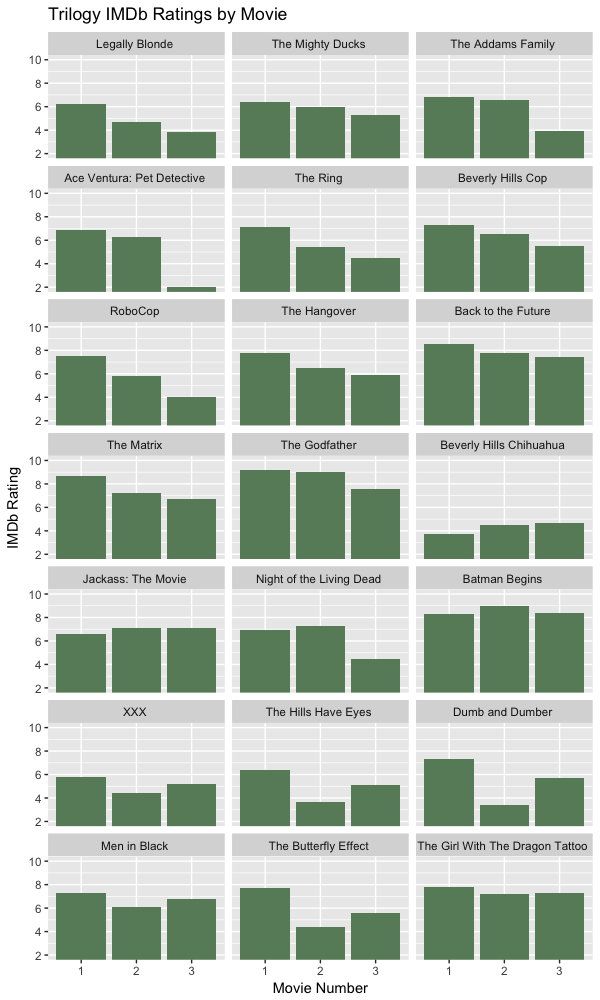
Among the biggest tanks were the Legally Blonde, Ace Ventura and The Matrix trilogies, while low-rated series like Jackass and Beverly Hills Chihuahua increased their ratings in later installments.
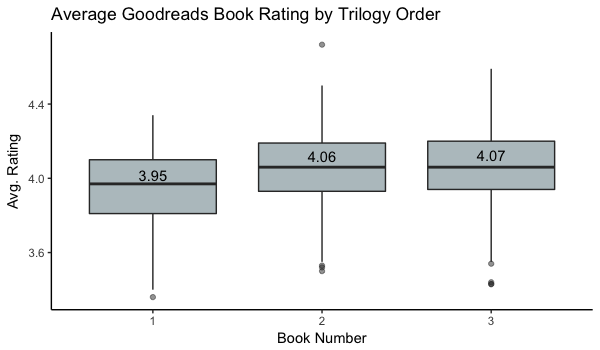
In aggregate, there is a visible increase from book 1 to book 2 in trilogies. Book 2 and book 3 appear fairly even. Variance decreases from book 1 to 2 and 3, supporting the theory that users who didn't enjoy book 1 didn't take the time to read and rate the following installments.
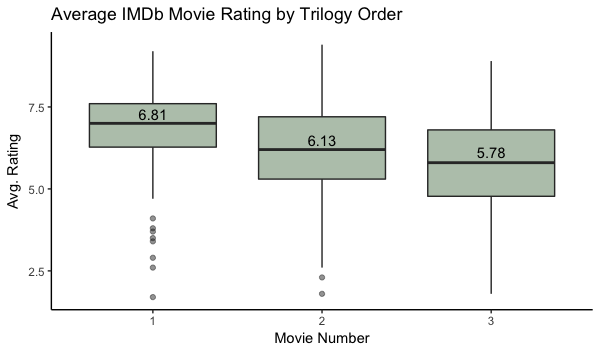
In movies, there is a very clear decrease in average rating moving from movie 1 to movie 2 to movie 3, with average scores dropping from near 7 to the mid-5s. Variance increases from movie to movie as well, indicating disagreement from fans in their ratings for later installments.
The Method
This by-no-means-exhaustive sample of trilogy series was grabbed from a user-ranked list at Goodreads and a list of movies with three installments from Wikipedia. Only series with exactly 3 installments were considered for this piece, and no series was excluded for not being initially planned as a trilogy.
Their number of ratings and average reviews were scraped from Goodreads and IMDb, respectively, keeping only the series with more than 1000 reviews for each installment. Note that Goodreads's average rating is truly an average, while IMDb's average rating is weighted.
Repeated Measures ANOVA
A repeated measures, or within-subject, ANOVA tests the homogeneity of group means. This test assumes that each individual subject participates in each treatment level. For example, this could mean testing response of subjects after 100, 200 and 300 mg of caffeine. Repeating each condition on each subject helps account for individual-level variance and reduces the total number of subjects needed.
This isn't a perfect match for the data at hand, but there is a measure (average rating) at three treatment levels (book 1, book 2, book 3) for each subject (trilogy series). Other extraneous factors, like the year the book was released or how many pages it has, have not been controlled for.
Here the null hypothesis is that book 1, book 2 and book 3 have the same average rating as opposed to the average rating of at least two differing significantly.
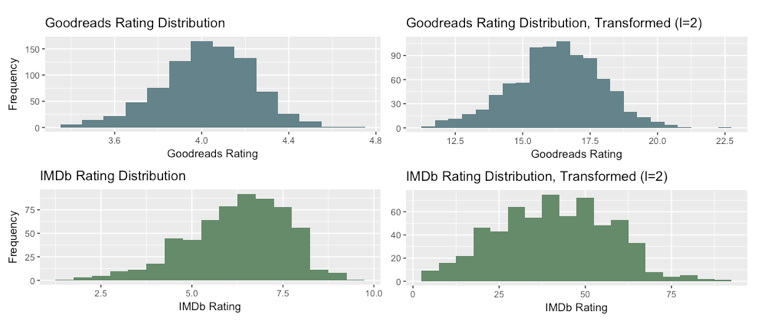
Normality
Repeated measures ANOVAs also assume that the dependent variable is normally distributed. Both the book and movie dataset failed a Shapiro Test for normality. Following a Box Cox transformation (both yielded lambda = 2), the book ratings were found to be normal (W=0.997, p=0.213) while the movie ratings were not (W=0.994, p=0.014). In more serious studies, this would be of greater concern.
ANOVA Output
The ANOVA for books is significant at p < 0.00 with a F score of 95.38. We can conclude that book number has an effect; books that are part of a trilogy do not have consistent ratings across all three books.
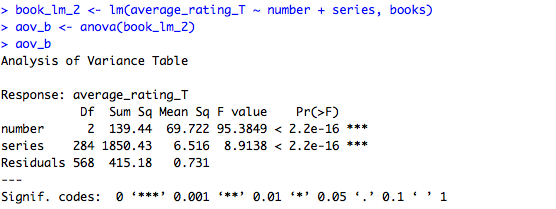
The ANOVA for movies is significant at p < 0.00 with a F score of 146.52. We can conclude that movie order is significant; movies that are part of a trilogy do not have consistent reviews across all three movies.
Sphericity
An assumption of the repeated measures ANOVA is that the groups have equal variances of the differences between all possible pairs of treatments. Both the book and movie dataset violate this assumption. To correct this, the function ezANOVA from the package ez was employed to calculate the Greenhouse-Geisser epsilon (GGe) correction on the degrees of freedom.
For books, the GGe = 0.759; for movies, GGe = 0.952. Both tests were still significant at p < 0.00.
Determining the effect direction
We have concluded that for both books and movies, at least two of the three treatment levels (book 1, book 2, book 3) are significantly different, but not anything about which are different or in which direction. To do so, we can look at pairwise comparisons.
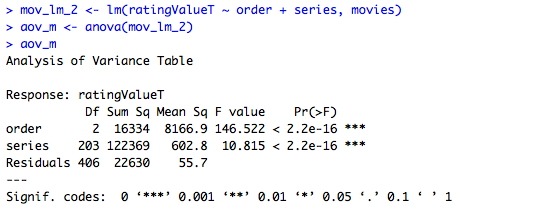
The function TukeyHSD provides pairwise comparisons of group means while keeping the familywise error rate within specified bounds. Below we unpack the output for both books and movies.
For books, the pairwise comparisons show that only the differences between book 1 and book 2 and book 1 and book 3 are significant, while book 2 and book 3 are not significantly different. With mean average ratings of 4.06 and 4.07 for book 2 and book 3, that's not surprising.
The differences between book 2 and book 1 and book 3 and book 1 are both positive, indicating an increase. Trilogies get a bump from book 1 to book 2 and maintain that higher rating through the end of the trilogy.
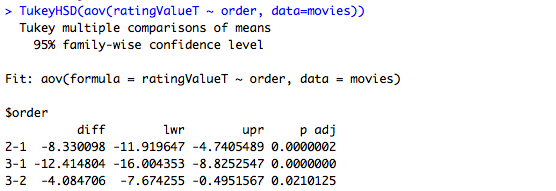
For movies, all three comparisons are significant, and all three have negative differences. That indicates that average ratings are decreasing from movie 1 to movie 2 and from movie 2 to movie 3.
Full dataset